

BY MARK HARROP X CHRIS JONES | APRIL 20, 2023 | 11 MINUTE READ
Identifying practical examples of sustainability improvement initiatives in fashion, and spotlighting the power of process breakdown and primary data.
This article is part of a larger series on Sustainability Return On Investment (or SROI), and should be read in order:
- Introducing, Measuring, And Managing SROI
- Preparing For Transparency With A Flexible Value Chain Backed By Data
- Defining The 'How' And The 'What' Of SROI - Part 1
In this, the second part in our focus on defining what a Sustainability Return On Investment (SROI) looks like, we want to provide four distinct examples, each one corresponding to a process taken from each of the 1 – 4 tiers of the supply chain. From a brand’s perspective, these examples correspond closely to real-world challenges and scenarios, and all are areas in which consumer and regulatory scrutiny is high, meaning that the potential return on making a measurable improvement on any of them is high.
First, though, some statistics for context. We all know the fashion industry generates colossal waste issues, contributing to an estimated 8% of global greenhouse gases. How do we tackle such a significant issue? The answer is ‘one piece at a time’. For example, let’s focus on the traditional sample-making process, which uses considerable resources to generate large quantities of discarded physical samples and is, by any definition, not sustainable.
Fashion Tech Week 2023 and Apparel Resource quote some statistics from the current traditional sample-making process that emphasises the opportunities to improve both sustainability and the bottom line;
- The fashion industry currently spends USD$ 6-8 billion on physical sample-making per year.
- Over 30% of materials are wasted during the seven stages of sample-making for a single piece of clothing.
- Most physical samples go directly to storage and ultimately to a landfill.
- If brands and factories chose to create only one physical sample for every garment style currently manufactured, they would reduce the cost of sample-making cost by USD$ 4.5-6 billion.
We’d love to tell you how to remove all physical samples and waste from ‘unselected’ prototype styles and deliver the USD$ 4.5-6 billion savings estimated above, but that is unrealistic. Designing, prototyping, and manufacturing, after all, remains an iterative, analogue process that is almost never “right first time”.
The fashion industry has already begun the sustainability improvement journey, and it’s just getting ‘serious’. However, this will be a decades-long journey if we ever complete and reach genuinely 100% sustainable practices.
The examples below are not a ‘silver bullet’, but merely practical examples of candidates for sustainability improvement initiatives. Each company must prepare their tools, map supply chain processes, collect associated primary data and prioritise the sustainability initiatives to execute for its business based on its own SROI assessment of each initiative.

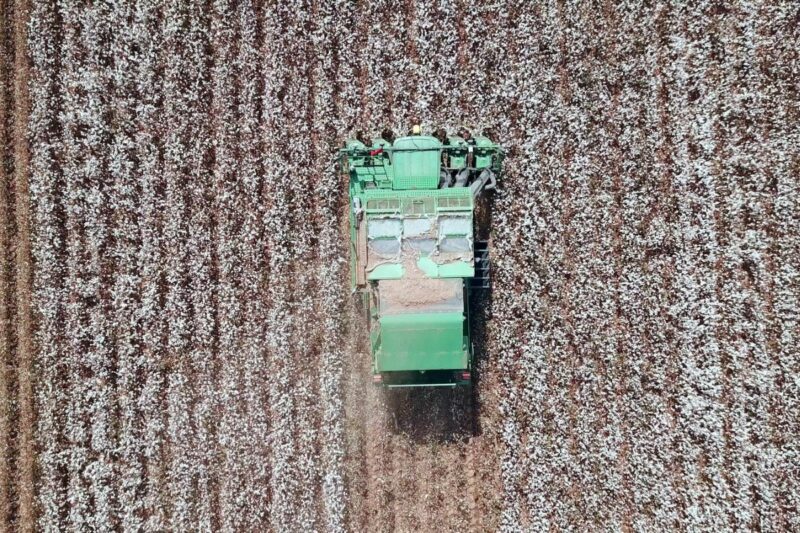
Using IoT (Internet Of Things) to help improve irrigation practices
If we investigate the water required to grow cotton, we find that one kilogram of conventional cotton requires 10K-20K litres of water to produce.
And if we list the top Global cotton producers during 2022, we see the massive volume of water used to grow these cotton crops.

That’s up to 420 billion litres, or 420 million m3 (cubic metres) of water used to grow cotton in those 8 countries. It’s also important to note that most cotton is grown in countries that are already facing water stress, making this resource utilisation especially unsustainable at both a humanitarian and environmental level.
Higher Cotton Yields with Less Water
Today, farmers are starting to implement computer vision and IoT technologies (Internet of Things) to help map their fields, measuring soil moisture via IoT devices to alert farmers to where water is needed to ensure healthy crops, and at the same time, ensure they are not over-watering areas with the precious resource. These IoT devices supported by AI/ML (Artificial Intelligence & Machine Learning) help farmers to deliver precision-targeted watering. There are different types of irrigation systems for cotton production; surface irrigation, sprinkler irrigation and drip irrigation systems. Each of these systems can utilise IoT devices to manage the water supply in the most efficient manner, examples would include watering during darkness to prevent the evaporation of water from the soil. The latest irrigation trend is a drip system where tubes run below the surface of a field, giving water directly to the crop’s root zone.
Initiatives such as the Better Cotton Stewardship have produced significant results showing that Better Cotton Farmers in four countries have used less water for the irrigation of cotton than Comparison Farmers, ranging from 6% less in Tajikistan to 13% less in India. For example, if we use the cost of a cubic metre (m3 / 1,000 litres / 1 kiloliter) of water in Maharashtra of USD$0.92, we find that a 13% potential saving of up to 16 million m3 of this precious resource applied across India would also save a cash value of USD$14.6M.

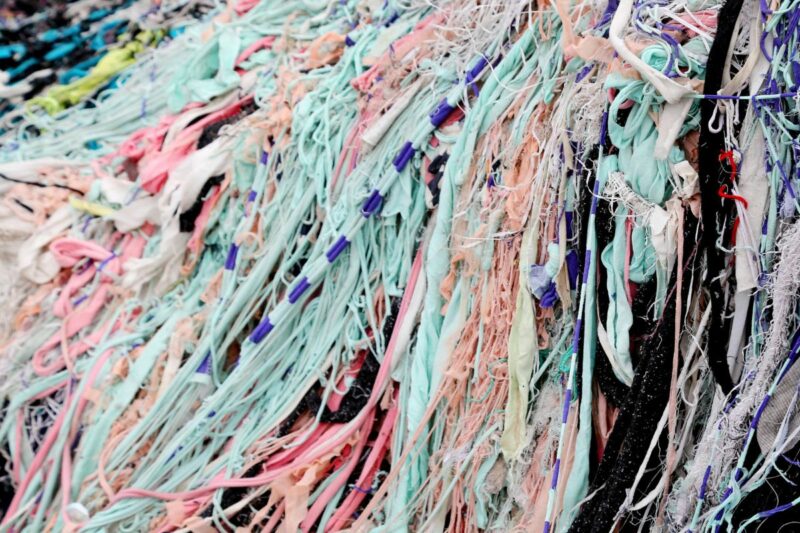
Digital dyeing of Thread and Yarn
Digital dyeing of thread and yarn supports on-demand production runs and sampling needs, producing significant sustainability benefits, with greatly reduced energy, 90% water reduction on average, and little or no waste materials, plus improved speed to market, accuracy of colour matching, and quality.
- No MOQs (minimum order quantities) and no material waste linked to DTM (dyed to matched) order requirements.
- JIT (Just-In-Time) on-demand production dyeing and sampling needs.
- Dramatic reduction in set-up time and energy resources linked to traditional dyeing methods.
- Greatly reduced stock and cost of materials using a standard greige thread/yarn.
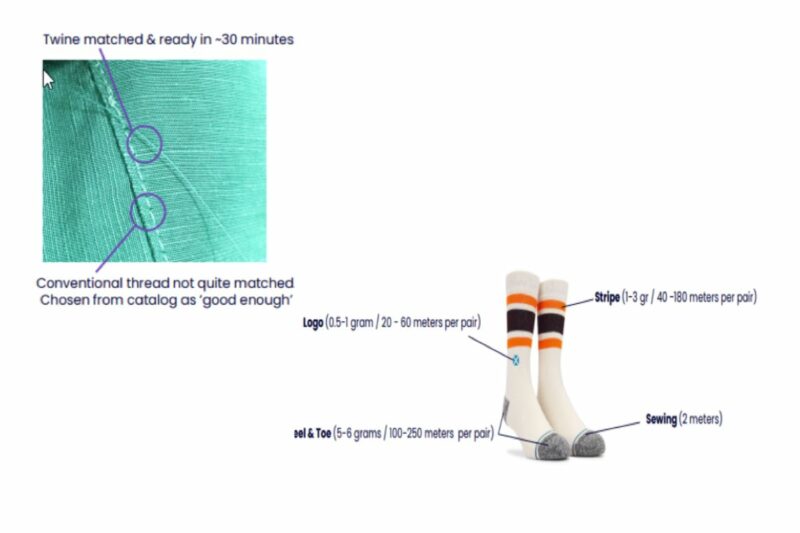
If we consider sewn small garment orders and sampling, thread in an exact colour match is essential. Similar applies to yarns used in knitted products. Brands’ and retailers’ time constraints require the ‘nearest’ catalogue colour, but often, colour matching isn’t good enough; the process completes several cycle iterations before final approval.
Issue
The key issue is matching the designers’ seasonal colours with a limited stock of thread/yarn catalogue colours. Several obstacles arise when a thread/yarn with a new DTM colour standard is required. The wet dye process requires a lead time of around 7-12 days to deliver the sample thread/yarns. On average, the thread MOQ is often 40 km (kilometres), compared to a sample requirement of 1-2km. This results in the potential waste of 38kms of thread, or 95% of the order if the colourway is not selected.
The same issue applies to limited yarn colours in stock. Additionally, multiple sections in socks often require multiple yarn DTM colours. The yarn waste for one section of a sock ranges from 30% for production runs to 99% for sampling, when a few grams of yarn are required, but MOQ is 1kg. The waste multiplies when several yarns in one sock style require a new colour standard. Like threads, the wet dye process for yarns requires a minimum lead time of around seven days or more, plus shipping duration. For production, yarn(s) will be over-ordered as a contingency, leading to excess inventory.
Wet dyeing waste for 10 pairs of sample socks & 2,800 pairs of batch production

Process change
Adopting digital dyeing technology, using greige undyed threads/yarns to deliver DTM (Dyed-To- Matched) materials that, in turn, can be used to deliver On-Demand (PLM, Bill of Materials) orders, and ‘exacting’ sampling requirements. Greige stock threads can be dyed in any colour standard, with 1-2 kilometres of sample threads produced in 30 – 60 mins.
Small orders of garments, socks (around 3,000 pairs), bags, footwear, accessories, and related soft-sewn textiles or knitted products can be made available for shipping within 2-3 days.
Benefits
In addition to the listed improvements, a reputational enhancement is linked to the improved quality of service provided. Timelines for raw materials with new DTM colours are reduced by over 80% on average. The digitally dyed materials can be available within 30mins onsite. If shipping is needed, factories and knitters can reduce their lead times from 7-12 days to 2-4 days.
Using greige thread/yarn dramatically reduces a factory or knitter’s stock levels and waste by avoiding MOQs, saving more than six thread cones per colour. Avoiding the wet dyeing process enables a >90% reduction in water usage and effluent creation, and a >90% reduction in Co2 equivalent greenhouse gas emissions.
We have been made aware of On-demand production and sampling lead times reduced by 30-70%. Digitally dyed sample yarns can be available within 1-3 days compared to a minimum of 7 days for wet dye processing, excluding shipping. The digital dyeing process enables a >90% reduction in water usage and effluent creation and a >50% reduction in Co2 emissions.
You can learn more about digital thread and yarn dyeing here.

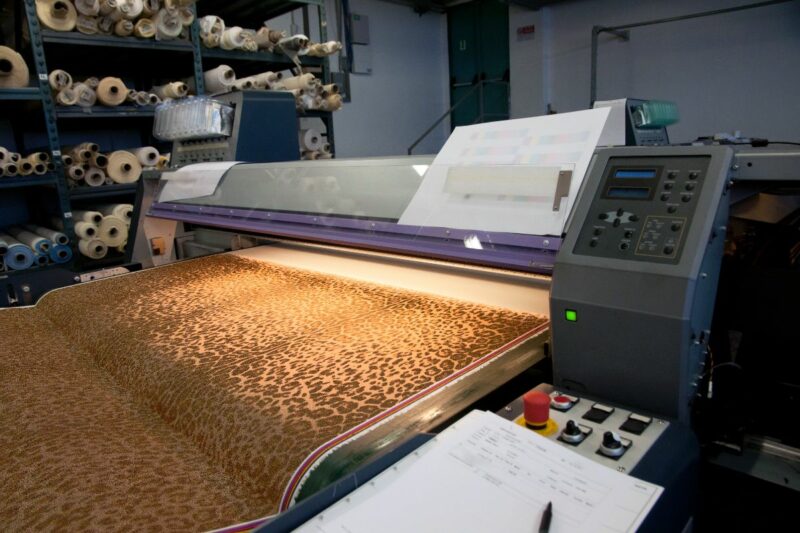
Traditional Fabric Printing vs Digital Fabric Printing
When designing printed fabrics, there are constraints when considering the traditional fabric printing process. The root of these issues is the cost and time required to create the different screens for multiple colour separations. Cost may constrain the designer to a maximum of 3 or 4 colours per print, and there will be an average 3-month lead time for bulk printed material.
Wet dyeing issues and efficiency limitations
The traditional printing process ‘efficiency threshold’ is around 1000 units, with the efficiency of energy and water use improving as volumes increase. Above 5000 units per print run, the waste produced per item is dramatically reduced. However, as the average industry order size decreases, the number of print runs above 1000 units, never mind 5000 units, per run is lowering.
When balancing constraints vs efficiency in traditional wet-dye printing, the ‘efficiency’ side of the ledger doesn’t prevail until there are large unit numbers per print run. Therefore, a more efficient and cost-effective alternative to traditional printing is needed for small production orders and all print sampling.
There are companies developing compelling benefits cases for digital printing. As the Direct To Garment (DTG) and Direct To Roll (DTR) install base continues to increase, and the technology is road tested and proven to be stable, there are more use cases for Print On Demand developing in traditional retail. Several factors are driving this interest.
- Speed to market – The ability to design a new print and make it ready for sale in days rather than weeks or months is a real game changer.
- Low MOQs – Removing the restrictions of MOQs makes the ordering process a lot easier.
- Sustainability – Reducing waste by only printing to fulfil the actual order, resulting in fewer products in landfills.
- Reducing water usage – Direct To Textile (DTT) is a waterless process, removing the gallons of water it takes to prep a screen for printing.
- Reduced carbon footprint – Producing and shipping from the closest point to order delivery.
- Risk-averse – Removing risk from the concept and design process. With DTG, colour is only limited by RGB. You can design with total freedom and are not constrained by the number of colours your manufacturer can produce.
- Test new markets – Try a new market with little or no risk, which may not be your core customer.
- Reduced stock holding – Running your business 100% on demand is now possible by taking advantage of the deep plain stock available and the ‘just in time’ principle.
Yes, digital printing machines, on the face of it, appear expensive. Still, plenty of digital printing service bureaux offer this capability, and when you measure the ‘true benefits’ you might find that the value of the machine outweighs the cost.
Lessons learned from mills’ efforts to reduce greenhouse gases
Like every partner business operating in the fashion supply chain, mills are working hard to achieve their sustainability goals. Some have gone down the route of reducing their energy resources, many have implemented water purification projects, and some have installed solar panels, spending six-figure sums that have helped transition 50-60% of their electricity to renewables, linked to SROI paybacks estimated in 3-5 years.
However, it has been discovered that projects of this nature to improve sustainability for the high energy processes required by mills and wet dye processes have limited impact on GHG emissions, many only resulting in single-digit reductions.
For these processes, a large element of emissions is derived from the generation of heat. To achieve double-digit emission reductions, mills will need to focus on reducing heat wastage, such as alternative energy generation from alternative fuel sources and efficient heating systems, with the best energy recycling and repurposing capabilities and IoT controls to ensure consistent energy usage.
This demonstrates the holistic approach that must be taken to find the best solution for the specific process to enable management and mitigation of ecological impact.

Design-By-Impact – is a new software tool that allows brand or retail designers to use process data to model a garment assembled with the materials and different manufacturing partners. In this scenario, several T1 factories may each use different types of machinery, or electricity consumption will vary and be charged at another value based on the country’s electricity (wattage) charges. Then you might want to consider the factory efficiency levels, fair labour rates, not to mention the type of transport (Air vs Sea) and miles/kilometres distance from the factory to the brand’s warehouse and ultimately down to the store location(s).
Design-to-impact tools will allow designers and developers to go deeper, for example, Fully Factored (responsible for obtaining and testing of materials, components & trims) vs CMT (cut, make & trim), ultimately each will have different costs of resources and transportation that in turn will impact the overall sustainability scores.
The power of process breakdown combined with primary data
As we have discussed, one of the most significant improvements in environmental impact and growth to the bottom line is understanding the effects of all processes.
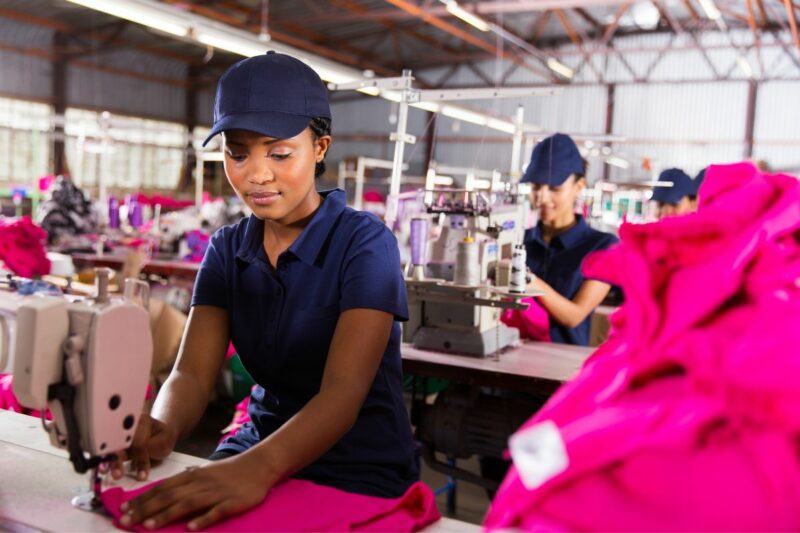
Let’s consider the sewing operations in a CMT factory. Each sewing operation involves multiple sewing machine types, each with different sewing motors and different amps/wattage. This adds to potentially significant energy usage variations across factories. This variation has an impact on CO2e Kg and cost.
For example, if we assume the wattage of all machines used to manufacture a garment in 2 factories is the same, and we used the published average $/kWh for businesses in June 2022, we see variations between neighbouring countries.
- China is ~22% more expensive than Indonesia or Vietnam.
- Pakistan is 25% more expensive than India and 45% more costly than Bangladesh.
- India is 16% more expensive than Bangladesh.
- Mexico is 42% more expensive than the USA.
- Nicaragua is 14% more expensive than Guatemala.
- Honduras is 29% more expensive than Nicaragua.
Additionally, if we considered textile mills in Europe, using the same published average $/kWh for businesses in June 2022;
- Italy is 178% more expensive than Spain.
These examples are a tiny element of the enormous quantity of processes and primary data that could be leveraged to provide our teams in the digital value chain with options for more sustainable and profitable products through informed decisions.
Design-By-Impact tools
The fashion industry needs the tools to capture the primary data and provide a simple and effective user interface for your team to compare processes and evaluate options.
The example below is a GHG Design-By-Impact tool that compares GHG impact for two supply chains. The data example applies to a suit with three linings, using the same fabric supplier in Italy, two alternative CMT factories (China and Romania), separate packaging, and Gate to Site (G-t-S) to the same warehouse in New Jersey via sea freight.
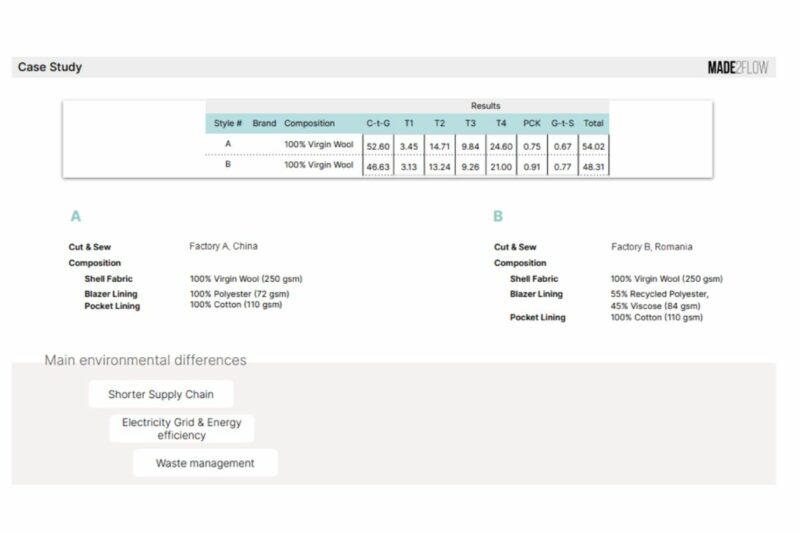
The CO2e Kg is calculated using Primary data collected from all associated supply chain processes and is summarised for each of the Tiers 1-4 plus Packaging (PCK), the Cumulative to Gate (C-t-G) volume for all the Tiers and Packaging, Gate to Site (G-t-S) shipping, and the total for the delivered product.
Comparison for each of these processing groups is provided, with insights into the environmental differences between the two variations of the supply chain. It becomes easy to identify the ecological benefits between 2 options, whether they are different locations with the same processes, different styling on the same product, or you are identifying improvements between processes. The team would combine this GHG data with other primary data, such as cost, fair wage, timescales and other ESG data, to make the final informed decision.
Design-By-Impact provides the team with the environmental ‘facts’ of each option, or equally, to enable your project team to assess, prioritise and validate environment process improvement in a phased approach. One of many tools that captures an element of primary data and provides insights to help make an informed decision. There is an enormous opportunity to combine all these insights to provide holistic insights to power the fashion industry forward into a new era of sustainability.
Conclusion
An enormous depth of information is embedded in the fashion industry supply chains. The work to extract and leverage this primary data is vast and is not something one company can do independently.
Specialist companies are leading the science-based collection and analysis of trusted primary data. The fashion industry must act to work together to agree on all the variations of primary data and create solutions to contribute to the holistic view of selected supply chains.
The good news is that solutions can be leveraged to enable compliance with the imminent legalisation. In addition, the same tools can be used to improve profits and substantiate sustainability credentials. However, the clock is ticking, and companies need to make a move before they are forced to do so.
Authors Mark Harrop & Chris Jones

Mark has worked for more than four decades to help the world’s best known retailers, brands & manufacturers achieve efficiency savings across their entire supply chain through informed technology investments.
Chris has helped global brands, retailers & manufacturers for more than three decades to align people, process & technology, driving transformation projects to provide maximum impact for the business.
This article is also published on;